How to Generate the End-of-Day Report
The End of Day report page shows the log of all Eod reports sent in a tabular form. The End-of-Day report for each day can be manually downloaded by clicking on the download button.
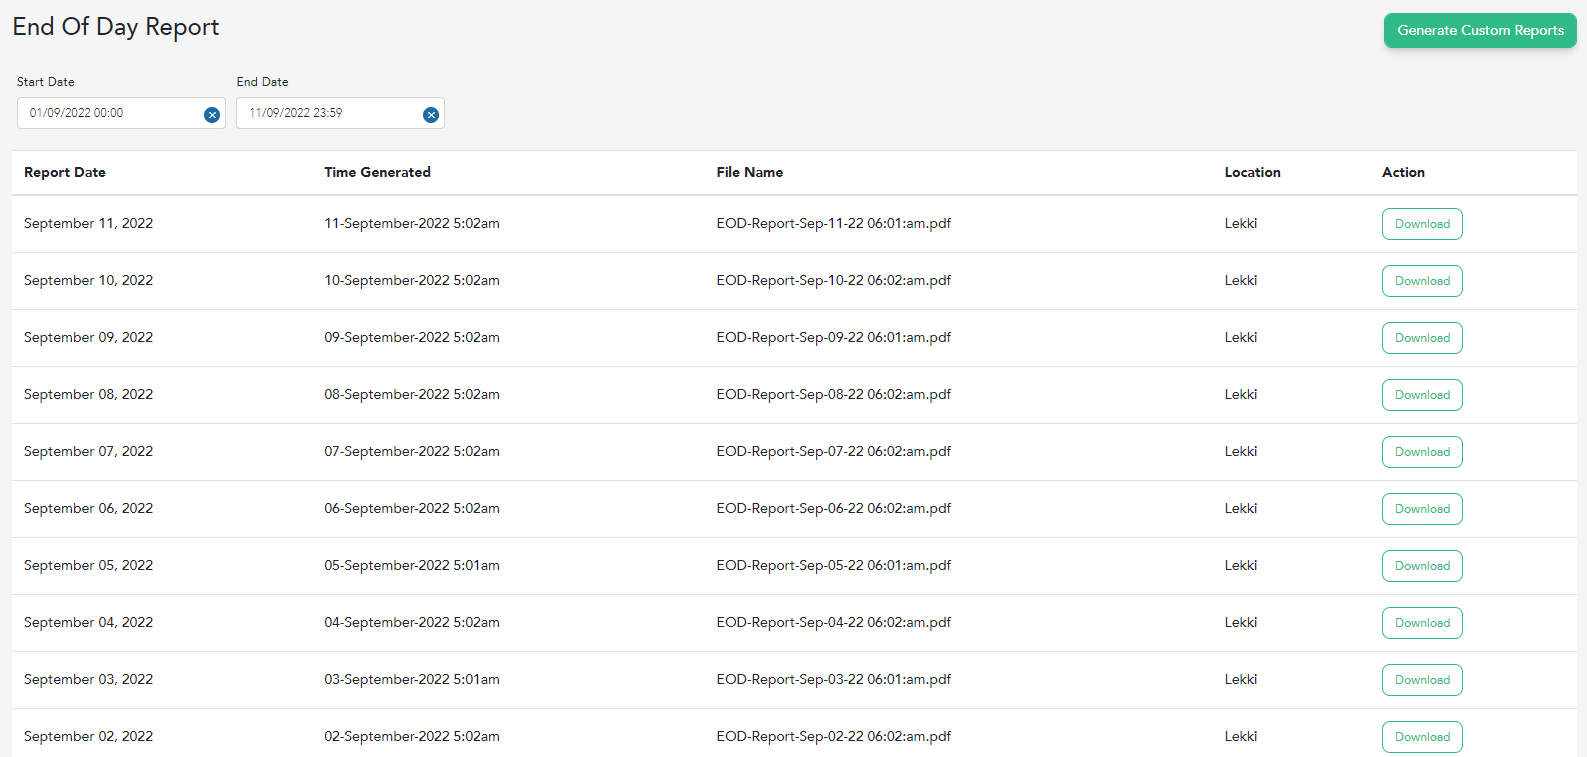
To generate an End-of-Day report by following these steps:
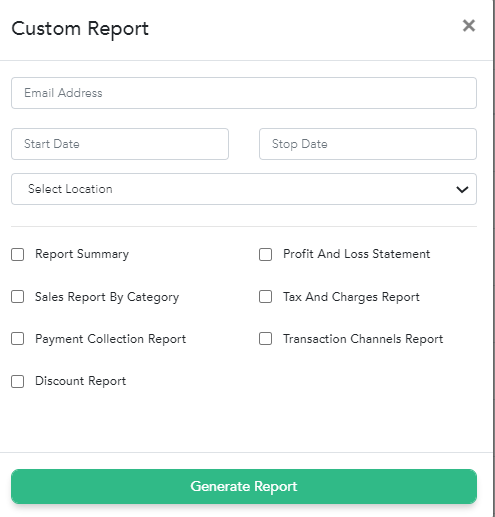
Click on the Generate Custom Reports button
This opens up a modal with necessary fields to update such as:
Email Address: This is the email address where the custom report would be sent to.
Start and End Date: This is the specified period of time in which the custom report details would cover
Location: This shows a dropdown of the restaurant location, if the user is managing multiple locations for the dashboard, this field would list all managed restaurant locations on the dropdown and a single restaurant location can be selected here.
The user can select reports that would be included in the custom report by selecting the checkbox for each report preferred.
Clicking on the Generate Report button sends the custom report to the email address updated.

Related Articles
How to Generate Sales Report
This report shows how much you make for each menu item sold each day, To access your sales report , please do the following Login to your backend using this https://africa.restaurant/ Click on Dashboard, to see the following Transaction Report , ...How to Generate Discount Report
The report provides information on the discount given on transactions within a specified period of time. This report can be filtered based on date and time To select a preferred date Click on the start or end date, it brings out a calendar, Select ...How to Generate Tax and Charges Report
This report page puts together all the charges and taxes charged on every transaction within the specified period of time. For a single transaction with multiple charges, each charge is displayed in a separate row. The table has a filter for the ...Understanding Inventory Dashboard/Reporting
The inventory dashboard displays three (3) values; Total Inventory Value: this is the total sum of the cost of inventory at hand. this value does not include expired stock. Total Variance Cost: This is the total amount of inventory not accounted for ...Understanding the Dashboard
The dashboard shows the summarized order information and can be filtered based on t your preference. Total Sales: This displays the total sales made within the selected time period. Average Order Value: This displays the average amount spent each ...